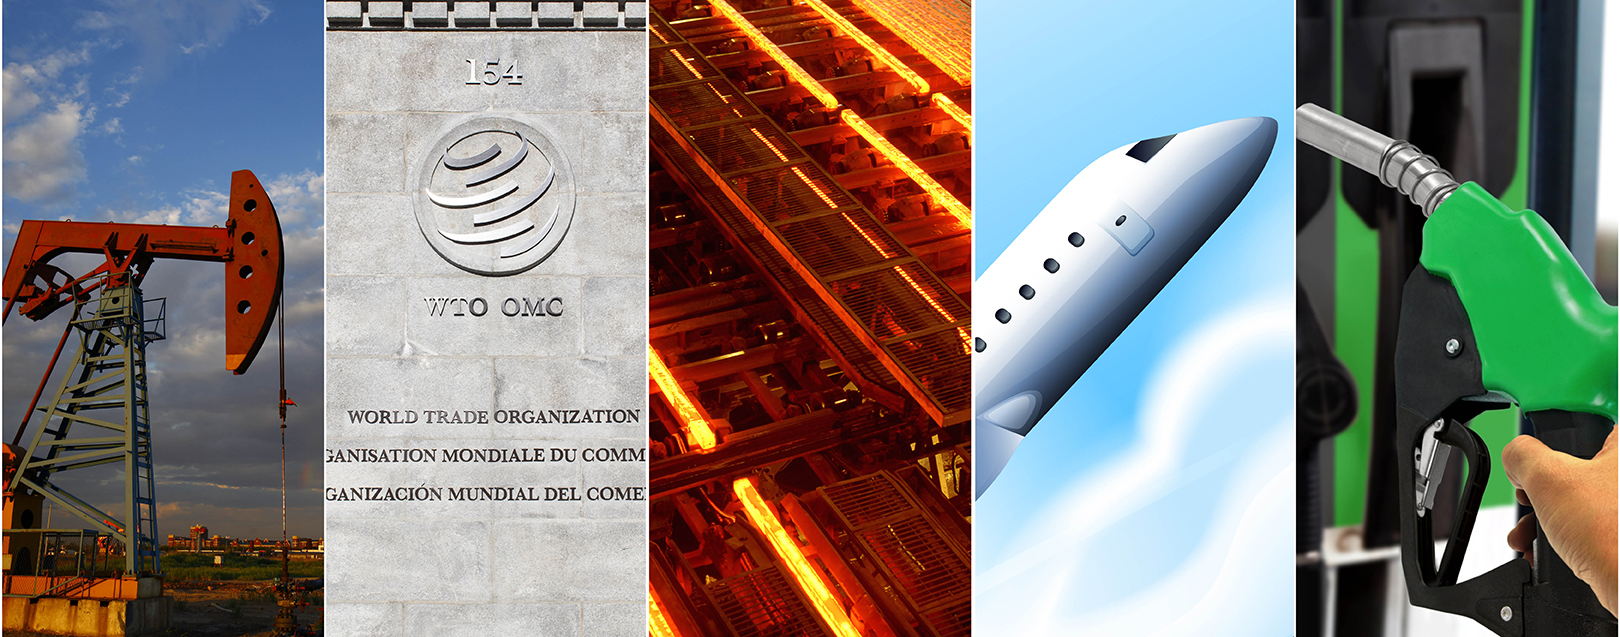
Glimpses from the week that was – Week 8 of 2017
By Abin Daya
India’s foreign trade
Exports:
- India’s exports rose continuously for the 5th month in Jan 2017. Exports rose by 4.3% to $22.12bn as against $21.2bn in the same month last year.
- Seventeen out of thirty major commodities had positive growth – key amongst them being rice, engineering goods, iron ore, and petro products
- However, exports have remained stuck between the $20-23bn range for the past two years, with non-oil exports remaining at $17-20bn per month
- Year to date, overall exports are marginally higher than last year. Against $218bn in 2016-17, export performance has hit $221bn in the Apr-Jan period this year, a growth of 1.23%
- While non-petro exports have grown marginally faster at 2.2%, petro exports have dropped by 5.8% during the same period

Source: Ministry of Commerce
Petro & non-Petro exports:
- The 29% growth in Petro exports in Jan 2017 should also be seen in the light of the low base during same period last year ($2.7bn against $2.1bn in Jan 16)
- If non-petro exports have remained relatively flat in value terms (despite USD appreciating), it points to drop in volumes as also pricing pressure being felt by exporters, which has prevented them from passing on higher costs, or even forcing them to drop prices
- A deeper analysis of individual commodities is needed to understand this more clearly
Imports:
- The movement in imports has been more pronounced, compared to exports, and that is also reflected in the movement in trade deficit, month-on-month
- Overall merchandise imports grew by almost 11% in Jan 2017, compared to the more sedate 4.3% growth in exports, and this has pushed trade deficit to grow by 28%
- The growth in imports during the month was driven almost exclusively by the increase in crude imports, which grew 61% y-o-y in Jan 2017
- Merchandise non-oil imports remained flat at $23.8bn during the month as against same period last year

Source: Ministry of Commerce
Imports-Oil & non-oil-FY17
- Considering that oil imports started dropping drastically from Jan 2016 till March, import performance will have the benefit of a low base for the next 3-4 months
- Overall merchandise imports have declined by 5.5% during the Apr-Jan period, compared to same period last year. This has been contributed to equally by oil and non-oil trade
- Despite ~10% drop in import volumes of crude (during the Apr-Nov 2016 period), oil imports have recovered in the past few months, driven by the recovery in crude oil prices and the depreciating rupee
- Oil imports during the Apr-Nov period were down by 13% as against same period last year, but the decline has now come down to 5.7% during the Apr-Jan period
Trade deficit:
- Merchandise trade deficit, which had dropped down to single digit ($bn) levels during the same period last year, has now gone back up to double-digit levels over the past few months. This has led to double digit growth in trade deficit in the recent months
- After rising for two consecutive months in Oct and Nov 2016, non-oil imports dropped by 3% in Dec 2016, which explains the almost 10% drop in trade deficit during the month

Source: Ministry of Commerce
Trade Deficit:
- The trend of rising trade deficit is expected to continue for the next few months, due to the low base effect
- However, considering that YTD trade deficit is still at $86.4bn, we are unlikely to breach the figure of $118.7Bn, the deficit for FY2016, in the next two months
Trade Facilitation Agreement of WTO comes into force
- The first multi-lateral trade deal in the history of the World Trade Organisation (WTO), the Trade Facilitation Agreement (TFA) came into force on Feb 22, 2017, after it was ratified by 112 members of the WTO
- To be accepted, the agreement needed to be ratified by two-thirds of the 164 members in the Organisation, which was achieved on the above date. India ratified the TFA on Apr 22, 2016
- The TFA is an attempt by the WTO to streamline and harmonise the export-import procedures and documentation amongst its member nations and improve transparency regarding the same amongst the interested parties (exporters/importers, transporters, etc.)
- It provides general guidelines on Exim procedures, documentation, tariffs and how these shall be disseminated, enforced and regulated
- It also pushes for usage of electronic medium in customs procedures, and calls for greater cooperation between customs organisations of member nations
- The apparent benefits are reduced cost of executing trade, which will drive more SME participation in global trade.
- As per certain studies, trade costs are expected to come down, on an average, by 14.3%, while full implementation of the TFA will increase global trade by approximately US$ 1 Trillion
- However, there are thoughts that the benefits of the TFA are hugely exaggerated and inflated. For example, a $1tn increase in global trade will require an increase of approximately $3tn to the global output
- Also, the political will needed to implement such an agreement might not be forthcoming in the current political scenario, when large parts of the world are becoming more inward looking, and returning to protectionism rather than becoming more open
- Finally, the current slow-down in international trade has more to do with the global economic conditions and less to do with Exim procedures. In that context, expecting the TFA to have a significant impact on promoting global trade might be a little misplaced
- While the intent of the initiative is, of course, good, the fear is that it might lead to efforts and scarce resources being diverted to an activity where the results might not justify the inputs. Undoubtedly, this needs to be watched closely as it unfolds
Global steel industry – India is the fastest growing major producer
- The Indian steel industry grew by 7.4% y-o-y in 2016, making it the fastest growing major steel producer in the world
- While global steel production remained almost flat (+0.9%), Chinese steel producers grew by 1.43%
- Japan and the United States, the other two major producers, saw their industry decline y-o-y by -0.32% and -0.35% respectively
- Below chart depicts the monthly performance of the industry in the various steel producing nations during 2016

Source: World Steel Association
Major steel producers-Growth in 2016
- Thanks to the excellent growth rate of the domestic steel industry, India’s share in global steel production has moved up from 5.5% in Jan 2015, to 6.3% in Dec 2016
- However, domestically, low demand and increase in input costs continue to put pressure on the profitability of the Indian firms, which have also been battling legacy issues of high debt levels and consequent high financing costs
.jpg)
Coking coal prices (US$)
- Coking coal prices have risen by as much as 2.5-3 times their levels in early 2016. While they have dropped from their highs that they saw in Nov 2016, they are still at significantly high levels, and this is hurting steel producers
Indian domestic aviation sector grows fastest amongst top 7 markets
- India’s domestic airlines grew by 23.3% y-o-y in terms of Revenue Passenger Km (RPK) in 2016, the fastest amongst the top 7 markets

Source: DGCA
Revenue passenger kms
- The Passenger Load Factor (PLF) of the Indian domestic aviation industry has also remained high at 83.8% - second highest amongst the 7 countries after US (84.8%)
- In terms of number of passengers carried, the Indian industry has grown at 23% y-o-y in 2016. Private carriers have grown much higher than the national carrier, Air India
- While Air India’s volumes have grown by 9.7% (133.4 Lakh passengers), private carrier volumes grew by 25.8% (677.6 Lakh passengers)
- Out of the private carriers, Spice Jet had the highest PLF at 93.7%, followed by Indigo at 91.4%

Source: DGCA
Marketshare of domestic airlines
- Indigo retains the highest market-share at 39.3%, while the national carrier has a market-share of 14.6% in 2016
Fuel consumption drops during Jan, but grows for the Apr-Jan period
- Consumption of petroleum products dropped y-o-y during Jan 2017, as against a consistent positive growth during the rest of the financial year
- Petrol consumption dropped by 0.55% in Jan to 1.8 Million Metric Tonnes (MMT) as against 1.81MMT in the same period last year
- However, for the Apr-Jan period, petrol consumption grew 10% from 18MMT to 19.8MMT
- Similarly, diesel consumption dropped from 6.3MMT to 5.8MMT in Jan 2017, a drop of 7.8%. For the Apr-Jan period, diesel consumption by 2.6% from 61.45MMT to 63.03MMT

Source: Petroleum Planning and Analysis Cell (PPAC)
Fuel consumption
- Consumption of all fuels grew by 7.3% during the Apr-Jan period, from 150MMT to 161MMT. During FY16, fuel consumption had hit 185.5MMT, growing at 11%, fastest in 16 years.
- While the oil ministry expects fuel consumption to hit 200MMT in FY17, it is likely to remain at about 193-195MMT, considering the average monthly usage of 16MMT
- However, election activities in many states during the month of Feb 2017 is likely to have driven up consumption in those states for campaigning activities, and hence Feb usage is likely to be higher
- India’s usage also needs to be seen against the usage of petroleum fuels at other countries such as the United States (~1bn tonnes) and China (550-575 MMT)


