Growth in economic activity and trade overshadowed by rising deficit
Abin Daya the author of 'Basics of Trade: An India Perspective' is a FEMA expert, a career transaction banker, with close to 15 years of experience in corporate and transaction banking, in India.
By Abin Daya
Well, the effect of that abysmal performance of the core sector had to have some effect on the IIP. IIP numbers have come in at the lowest in 4 months with -1.2% growth. However, the coming months might give us some respite considering the improvement in economic activity during the month of March.
And speaking of March, we have got a second consecutive month of double digit export growth during the month, and that has helped us pull off a positive growth in annual export figures after two years of decline. That is truly noteworthy.
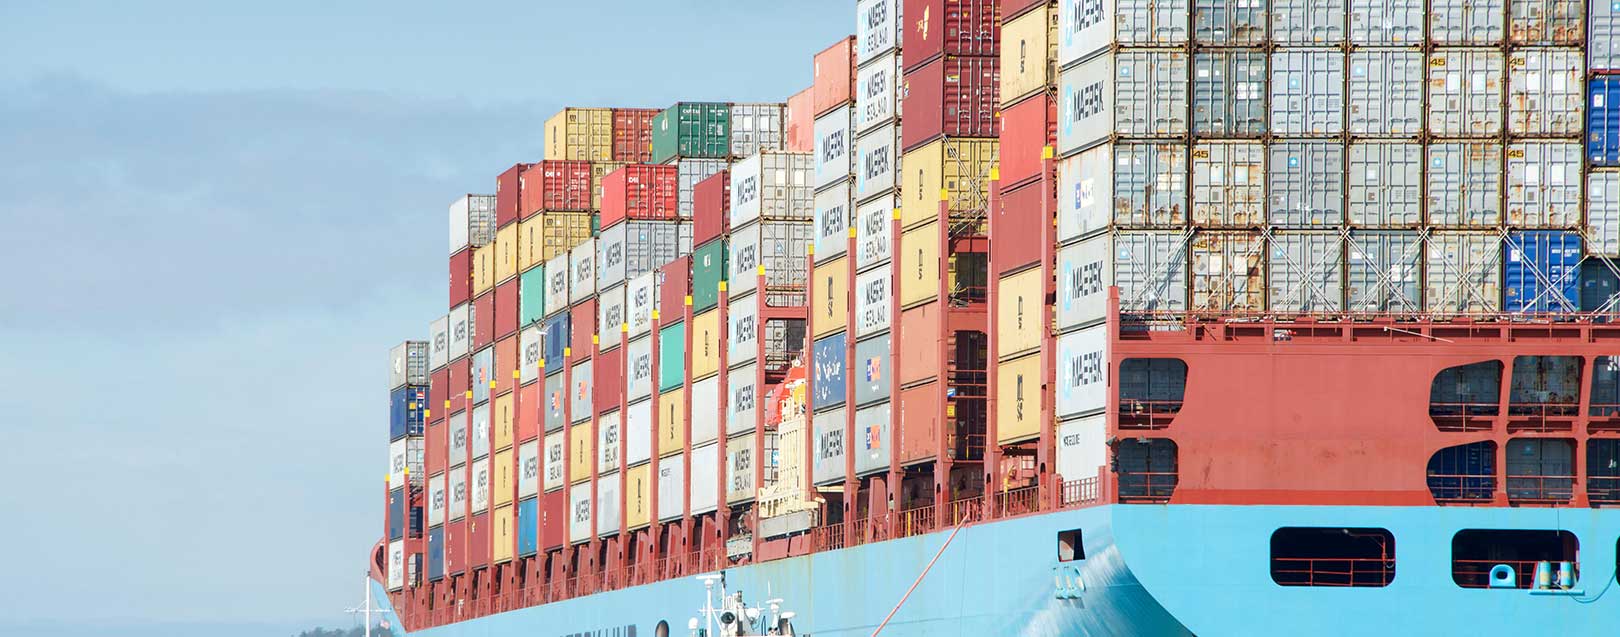
However, imports are rising at a faster pace, thanks to resurgent gold imports and rising crude prices, and this, in turn, is driving up the trade deficit. India exports for a total value of about $275-280Bn a year, while importing for about $380Bn. This results in a trade deficit of about $105-110Bn. Where does the foreign currency come from to pay for these additional exports? Services trade has some answer.
We also look at the vegetable oil extraction industry this week. A record output of oil seeds has led to record levels of production, and thus falling imports.
We are awaiting the final figures of the financial year to come out, so expect more detailed analyses soon.
Indian exports post growth after 2 years of decline
- Exports grew in double digits for the second consecutive month in Mar 2017 at 27.59% y-o-y to $29.32Bn as against $22.91 bn a year back
- Starting from Sep 2016, export growth has been on the positive track consecutively for 7 months now
- The double-digit growth in March has come on the back of growth in petro products (69.1%), engineering goods (46.7%), Ready-Made Garments (20%) and Gems & Jewellery (12.5%)
- This strong performance has helped take overall exports during FY17 to 4.83% growth over previous year, after two years of declining trend

- Imports for the year remained more or less flat for the year, compared to FY17, and this helped achieve a drop in Trade Deficit by about $12.3Bn
- Oil imports more than doubled in March 2017, growing 101.4% to $9.71Bn, while gold imports surged by 329% to $4.2Bn and pearls, precious & semi-precious stones by 56.7% to $3Bn
- These helped imports in March to grow significantly by 45.25% y-o-y to $39.67Bn as against $27.3nBn during same month last year
- The rise of crude prices in recent times has also seen the percentage share of oil imports increasing in the recent times

- This has also led to a consequential rise in trade deficit, which has moved up to $10.44Bn in March
- Services trade is helping to cover a portion of the trade deficit by way of the monthly surplus that it generates

- India’s service trade generates a surplus of more than $5Bn a month, resulting in an overall surplus of about $65Bn
- Still there is a gap of about $40Bn, which is funded by foreign currency borrowings, short and long-term
- The efforts to promote exports and increase the competitiveness of our exporters assume significant importance from that perspective
- Trade deficit for merchandise trade grew by 137% to $10.44Bn, but that was also the result of a low base
- From a level of $25-26Bn, imports are now normalising themselves to the normal level of about $33-34Bn
- Looking at the low levels of numbers during Q1 of FY17, it is likely that we will see strong trade growth in the next 3-4 months. The question is if it will be sustained after this period, once the base effect wears off.
IIP falls to a 4-month low
- Following the unimpressive core-sector growth of 1% in Feb 2017 which we had talked about last week, industrial production fell to a 4 month low of -1.2% y-o-y for the month
- Manufacturing sector performance, with a weightage of 75.5%, declined by -2%, while electricity sector grew by just 0.3%, lowest in 6 months

- Considering that industrial performance in Feb 2016 was also a very staid 1.9%, we can rule out base effects as the reason for the poor performance
- Cumulative performance for the 11 months in the FY is at 0.4%, as against 2.6% in the same period last year
- Looking at the use based classification, Basic Goods grew at 2.4% y-o-y (5.4% last Feb), Capital Goods at -3.4% (-9.3% last Feb), and -0.2% for Intermediate Goods (4.9% last year)
- The fall in capital goods is especially notable because it comes on top of a negative growth in Feb 2016 too
- The growth figures for the Apr-Feb period for last year and this year too are not very confidence inducing for this segment

- In the Consumer Goods segment, Durables grew by -0.9% in Feb and by 4.7% during Apr-Feb period
- Performance of non-durables was -8.6% and -2.9% respectively during the same period
- The economic numbers for the month of March seem to paint a better picture, with cargo handling at major ports and auto production numbers showing improvement
- Hopefully this will translate to better numbers for March
Import of vegetable oils dip by 9%
- Indian imports of vegetable oils dipped by 9% y-o-y in FY17, driven by significant drops in the months of Jul 2016 (-24%) and Oct 2016 (-30%)
- Vegetable oil imports, edible and non-edible declined by 7% in Mar 2017 to 1.11Mn tonnes as against 1.19Mn tonnes in the same month last year

- The oil industry follows its own season, with the oil year starting from Nov and ending in Oct
- In the first five months of the current oil year, imports have fallen by 8% y-o-y, from 6.32Mn tonnes to 5.79Mn tonnes
- While imports have fallen, the country also has more than enough inventory of oil at ports and in pipelines

- Overall inventory as on 01 Apr 2017 is at 1.91Mn tonnes, which is about 52,000 tonnes less than what it was a month back
- India’s monthly requirement is about 1.65Mn tonnes, and the country operates with a 30 day inventory, against which the current stock represents 35 days requirements
- Inventory has reduced during the year by 17% from the levels of Apr 2016 at 2.31Mn tonnes; a drop of about 400,000 tonnes
- This drop in inventory, combined with spike in domestic production due to a record harvest of oil seeds (33.60Mn tonnes in 2015-17) and slow-down in consumption are the drivers of the current decline in import figures
Some numbers to note
|
Parameter |
Level |
As on |
|
Indian Crude Basket |
$ 54.92 |
12-Apr-17 |
|
₹ 3,552.86 |
12-Apr-17 |
|
|
USD/INR |
64.41 |
12-Apr-17 |
|
FX reserves |
$ 369 Bn |
07-Apr-17 |
|
MIBOR O/N |
6.10% |
13-Apr-17 |
|
MIBOR 1 month |
6.36% |
13-Apr-17 |
|
MIBOR 3 months |
6.48% |
13-Apr-17 |
|
LIBOR 6 months |
141 bps |
13-Apr-17 |
|
LIBOR 12 months |
178 bps |
13-Apr-17 |

Abin Daya the author of 'Basics of Trade: An India Perspective' is a FEMA expert, a career transaction banker, with close to 15 years of experience in corporate and transaction banking, in India.


 to success.